

It’s Friday, the sales data is in—and now you have to turn it into a report.
Clean the spreadsheet. Combine this week’s numbers with historical data. Update formulas. Check totals. Compare regions. Figure out what changed. Then write the report.
If you do this every week, the problem probably isn’t Excel itself. It’s the repetitive work around it.
The good news? You don’t need to replace Excel. With tools like Power Query, PivotTables, reusable formulas, and an Excel Data Analyzer, you can automate much of the process—from cleaning and organizing data to uncovering the insights hidden in it. That means less time preparing spreadsheets and more time understanding what the numbers actually mean.
Here are five practical ways to automate Excel sales data analysis and get to the numbers that actually matter faster.
What Makes Excel Sales Reporting So Time-Consuming?
A weekly sales report often looks simple once it’s finished. But getting there can involve a surprising amount of repetitive work.
Cleaning and Combining Data Takes Too Much Time
The first problem usually starts before you analyze anything.
Your CRM or sales platform exports a new Excel or CSV file every week. The columns may be in a different order, dates may use different formats, and product or region names may not be consistent.
You then have to remove unnecessary data, fix formatting issues, standardize values, and combine the new records with your historical data.
Doing this once isn’t a big deal. Doing it every Friday is.
This is where Power Query can make a big difference. Instead of manually cleaning and combining each new file, you can build a repeatable data transformation process and refresh it whenever new data arrives.
The goal isn't to eliminate Excel. It's to stop doing the same cleanup work from scratch.
Repeating the Same Calculations Every Week
Once your data is clean, you still need to calculate the metrics that go into your report.
Total revenue. Number of orders. Average order value. Month-over-month growth. Regional performance.
If you're copying formulas across worksheets every week, you're spending time maintaining the report instead of analyzing it.
A better approach is to build your calculations into a reusable template. Structured references, Excel formulas, PivotTables, and calculated fields can handle many recurring metrics automatically.
Then, when the new sales data comes in, you refresh the underlying data instead of rebuilding the calculations.
That small change can turn a weekly reporting task from a manual process into a refresh-and-review workflow.
Finding the Insights Behind the Numbers Is Hard
This is usually the part that requires the most actual thinking.
Seeing that sales dropped 8% is easy. Figuring out why they dropped is harder.
Did one region underperform? Did a particular product lose sales? Did order volume fall, or did average order value decrease? Is this a one-week anomaly or part of a longer trend?
PivotTables and charts can help you spot these patterns quickly. AI can also be useful when the analysis moves beyond straightforward calculations. You can give an AI tool your cleaned sales data and ask it to identify unusual changes, compare regions, explain trends, or suggest questions worth investigating.
The important distinction is that automation shouldn't replace the analysis. It should remove the repetitive work that gets in the way of it.
Once the cleaning, calculations, and basic comparisons are automated, you can spend more time asking the question that actually matters:
What is the sales data telling me?
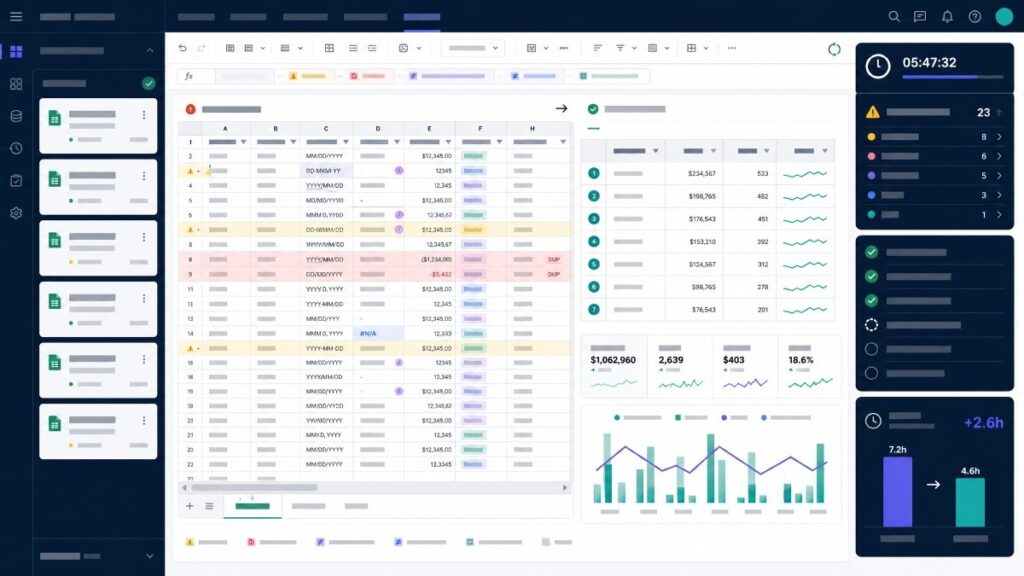
5 Ways to Automate Excel Sales Data Analysis
1. Use Power Query to Automate Recurring Data Cleaning
If you receive a new sales file every week, start here.
Suppose every Friday you receive a file containing order date, product, region, salesperson, quantity, and revenue. Before you can use it, you always perform the same cleanup: remove a few columns, change data types, standardize product names, filter out invalid rows, and combine the new records with your historical data.
There's little value in doing those steps manually every week.
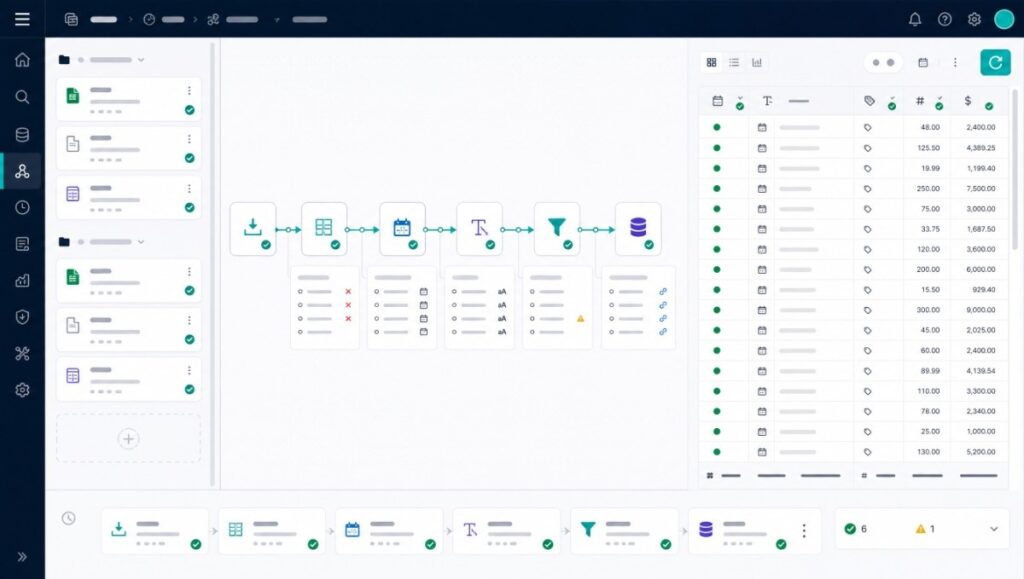
Power Query lets you build the transformation once and reuse it. Excel can import files from a folder, combine files with the same structure, apply transformations, and then refresh the query when new data arrives. Microsoft specifically recommends the folder approach when you have multiple files with the same schema that need to be combined over time.
A simple setup might look like this:
Weekly sales files → Power Query → cleaned sales table → report
The first time takes some setup. After that, your Friday routine can become much simpler: put the new file in the designated folder and refresh the query.
Power Query can also merge related datasets. For example, you might have one table containing transactions and another containing product information or sales targets. A Merge operation can join related tables using a common field, while Append can stack rows from different queries into a single dataset.
This is particularly useful for sales reporting because the source data often arrives from different places.
The important thing is that Power Query isn't really “an Excel trick.” It's a way of turning a series of manual cleanup actions into a repeatable process.
Once the query is set up, Excel can apply the same transformation steps when you refresh the data.
If your weekly report starts with the same messy process every Friday, this is usually one of the highest-value things you can automate first.
2. Build Your Recurring Sales Analysis with PivotTables
Once the data is clean, don't rebuild the analysis from scratch every week.
A PivotTable is often enough to turn a large transaction table into something useful.
Imagine you have 50,000 sales records. Your manager wants to know which regions generated the most revenue this month.
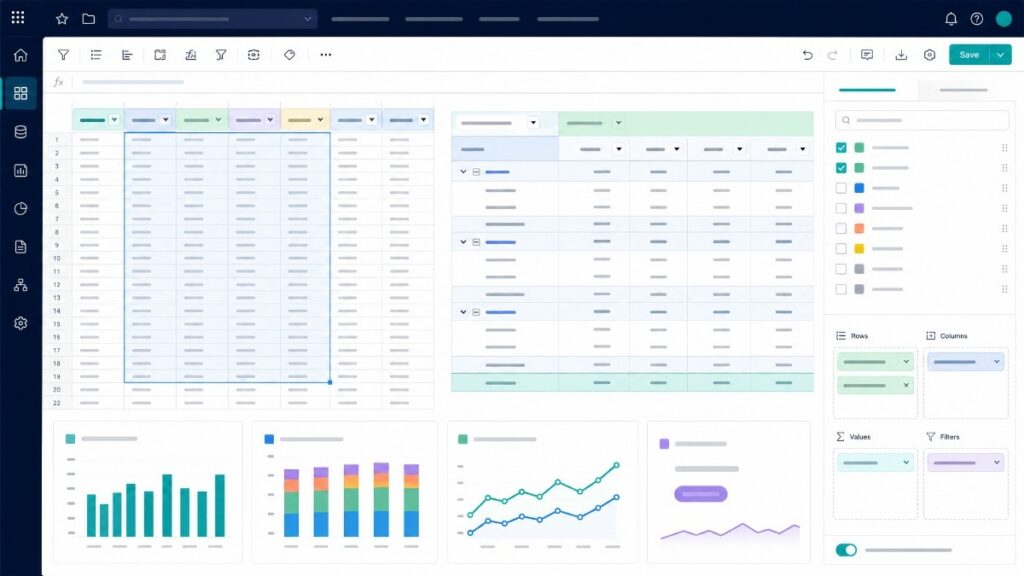
Instead of manually filtering the raw data, create a PivotTable with Region as the row field and Revenue as the value. Add Month if you want to compare periods, or Product if you want to understand what's driving a region's performance.
You can use the same idea for questions such as:
- Which products generate the most revenue?
- Which regions are growing fastest?
- Which salespeople are contributing the most sales?
- Which product categories are declining?
- How does this month compare with last month?
This is one reason PivotTables remain useful even when you're using AI elsewhere in the workflow. If you already know exactly what you want to compare, there is no need to ask an AI tool to reinvent the calculation.
Build the view once, keep the underlying data structured, and refresh it when the source data changes.
The same principle applies to formulas. If your weekly report always needs revenue growth, order count, or average order value, calculate those metrics in a reusable part of the workbook instead of manually rebuilding them.
For example, a simple sales-growth calculation can be:
=(Current_Month-Previous_Month)/Previous_Month
And an average order value can be calculated as:
=Total_Revenue/Total_Orders
The goal isn't to make your spreadsheet complicated. It's to make the numbers you check every Friday appear automatically.
3. Use Excel Automation When the Report Itself Is Repetitive
Sometimes the problem isn't the analysis. It's everything you do after the analysis is finished.
Maybe you need to create several versions of the same report for different teams. Maybe you filter the same PivotTable, copy the results into separate workbooks, add the same headers, save each file, and send them to different people.
That is still manual reporting, even if the underlying data is automated.
This is another pattern that comes up frequently in Excel communities. One user described having to generate 140 client reports every month from a large PivotTable, with the same filtering, formatting, copying, and distribution process repeated for every client. Another recent discussion involved creating several daily sales reports and emailing them to different managers, with Power Query suggested for shaping the data and Power Automate for handling distribution.
Depending on your setup, this can be handled with tools such as Office Scripts, VBA, or Power Automate.
The exact solution depends on what happens after your analysis is complete. If you're simply refreshing one workbook, you may not need anything beyond Power Query and Excel. If you're generating multiple reports and sending them to different people, a workflow tool can remove another large chunk of repetitive work.
The key is to look at the entire reporting process rather than stopping once the numbers are calculated.
A report that still requires 30 minutes of manual formatting and emailing isn't fully automated.
4. Use an AI Excel Data Analyzer When You Need to Understand the Numbers
This is where AI becomes genuinely useful.
Traditional Excel tools are excellent when you know what you want to calculate.
But sales analysis often starts with a much less precise question:
Why did revenue drop?
Suppose your weekly report shows that revenue is down 8% compared with last month.
You could manually create several PivotTables to investigate it. First by region, then by product, then by salesperson. You might calculate order volume and average order value and keep drilling down until you find an explanation.
Or you can start with the question.
Ask an AI Excel Data Analyzer:
Analyze this sales data and explain the main reasons revenue declined this month. Identify the regions, products, and sales metrics that contributed most to the decline.
Now you can follow the result.
If the analysis shows that the Northeast region accounts for most of the decline, ask:
Which products caused the decline in the Northeast region?
If two products stand out, continue:
Was the decline in these products caused by fewer orders, lower average order value, or both?
Then:
Compare these products with the previous three months and tell me whether this looks like a temporary drop or an ongoing trend.
This is where an Excel Data Analyzer can be much more useful than simply generating another spreadsheet summary. You're not asking the tool to calculate one number. You're using it to investigate a business question and decide what to look at next.
TutorGPT's Excel Data Analyzer is designed for this kind of workflow. You can upload your workbook and ask questions about the data in natural language rather than manually constructing every analysis.
The important distinction is that AI doesn't have to replace the Excel workflow you've already built.
Your Power Query can still handle the recurring cleanup.
Your PivotTables can still handle standard reporting.
Your formulas can still calculate the metrics you trust.
AI simply gives you another way to investigate the parts of the data that aren't covered by your standard report.
That makes it particularly useful when the question changes from week to week.
5. Turn the Insights Into a Report You Can Reuse
There's one final step that is easy to overlook.
Finding the insight isn't the same as communicating it.
You may have discovered that revenue declined because two products underperformed in one region. But if your final report still consists of a spreadsheet with dozens of tabs and numbers, someone else has to figure out what matters.
A better weekly workflow separates the data from the explanation.
Your spreadsheet can contain the detailed numbers.
Your report can focus on the few things people actually need to know:
What changed?
Why did it change?
What should we pay attention to next?
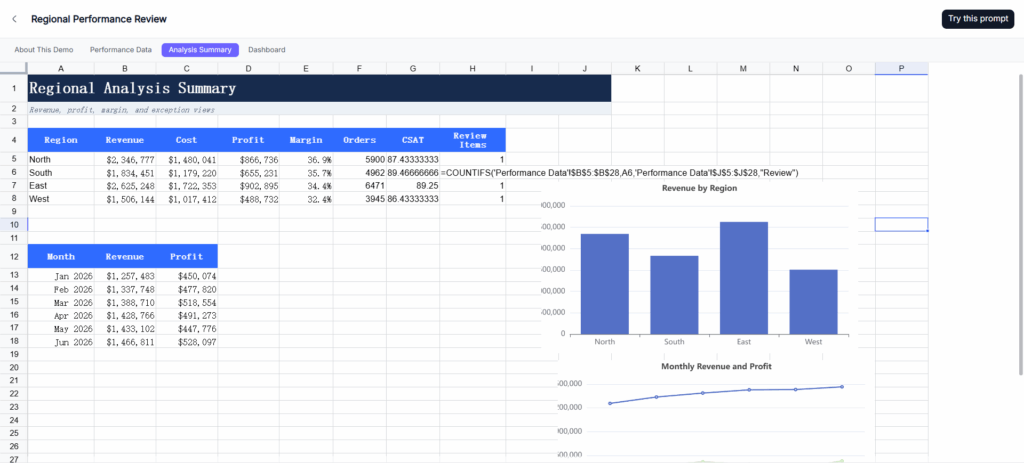
AI can help turn the analysis into a concise summary, while your existing Excel report can remain the source of the underlying numbers.
This is also where a reusable report template helps. Keep the same structure from week to week so that readers know where to find revenue, growth, regional performance, product performance, and key findings.
Then the only thing that changes is the information.
The goal isn't to create a completely different report every Friday.
It's to create a reporting system where the routine parts update themselves and your attention goes to whatever is actually new.

Best Tools to Automate Excel Sales Data Analysis
There isn't one tool that is best for every part of the process.
Excel + Power Query is a strong choice when your biggest problem is repeatedly importing, cleaning, combining, and refreshing structured data. Power Query supports folder-based file consolidation, merging and appending queries, and refreshing previously defined transformations.
PivotTables and formulas are still the simplest option for recurring metrics and structured sales reports. If you already know the dimensions and calculations you need, there's little reason to make the workflow more complicated.
Office Scripts, VBA, or Power Automate become useful when the report needs to do more than calculate numbers—for example, creating multiple versions of a report or distributing the finished files. Real-world Excel users often combine data preparation with a separate automation layer for this final step.
AI Excel Data Analyzers are most useful when the analysis is exploratory. Instead of knowing exactly which formula or PivotTable you need, you can start with a question and investigate the data through follow-up questions.
For most teams, the best solution isn't choosing one of these.
It's combining them.
Tips for Automating Excel Sales Reports
Automate the repetitive parts first. If you spend 30 minutes cleaning the same data every week, solve that problem before trying to automate a complicated analysis.
Keep your source data consistent. Power Query works especially well when recurring files share the same structure, column names, and data types. Microsoft recommends keeping files in a dedicated folder and maintaining a consistent schema when using folder-based imports.
Build around business questions, not just metrics. Revenue, orders, and growth rates are useful, but the real value comes from knowing what those numbers mean.
Don't use AI for everything. A simple formula is often better for a simple calculation. AI is more useful when you need to investigate patterns, compare multiple dimensions, or explore a question that doesn't have an obvious formula.
Verify important findings. AI can accelerate analysis, but important sales and financial conclusions should still be checked against the underlying data before they go into a management report.

FAQs About Automating Excel Sales Data Analysis
Can AI analyze an Excel sales report?
Yes. AI tools can analyze structured Excel data, compare periods, identify patterns, and answer questions about products, regions, sales performance, and other metrics. For important business decisions, always verify the underlying figures.
What is the best way to automate a weekly Excel report?
Start with the repetitive parts. Power Query is useful for importing, cleaning, and combining recurring datasets. PivotTables and formulas can handle standard metrics, while automation tools can help distribute finished reports.
Is Power Query better than AI for Excel automation?
They solve different problems. Power Query is usually better for predictable, repeatable data transformations. AI is more useful for exploratory analysis and questions that change from one report to another.
Can I use AI to find why sales dropped in Excel?
Yes. Instead of asking AI only for a summary, ask it to investigate the change: which regions contributed to it, which products were affected, and whether the change came from order volume, average order value, or another factor.
How can I automate Excel sales data analysis without replacing Excel?
You don't need to replace Excel. Keep Excel for your existing calculations and reporting, use Power Query for recurring data preparation, and add an AI Excel Data Analyzer when you need to investigate questions that are difficult to answer manually.
Conclusion
A weekly sales report shouldn't require you to start from zero every Friday.
Clean the recurring data with Power Query. Build the standard numbers into reusable Excel reports. Automate repetitive distribution where it makes sense. And when you need to understand why the numbers changed, use AI to investigate instead of building another analysis from scratch.
The goal isn't to automate every part of sales analysis.
It's to stop spending your Friday on work that has already been done before.
Once the repetitive work takes care of itself, you can spend your time on the part that actually matters: understanding the numbers and deciding what to do next.