
































AI Excel Data Analyzer

Upload spreadsheets, generate charts, discover insights, and create reports.

See It in Action

Real workbooks analyzed by TutorGPT's AI Excel Data Analyzer. Tap any example to preview the full data and charts.

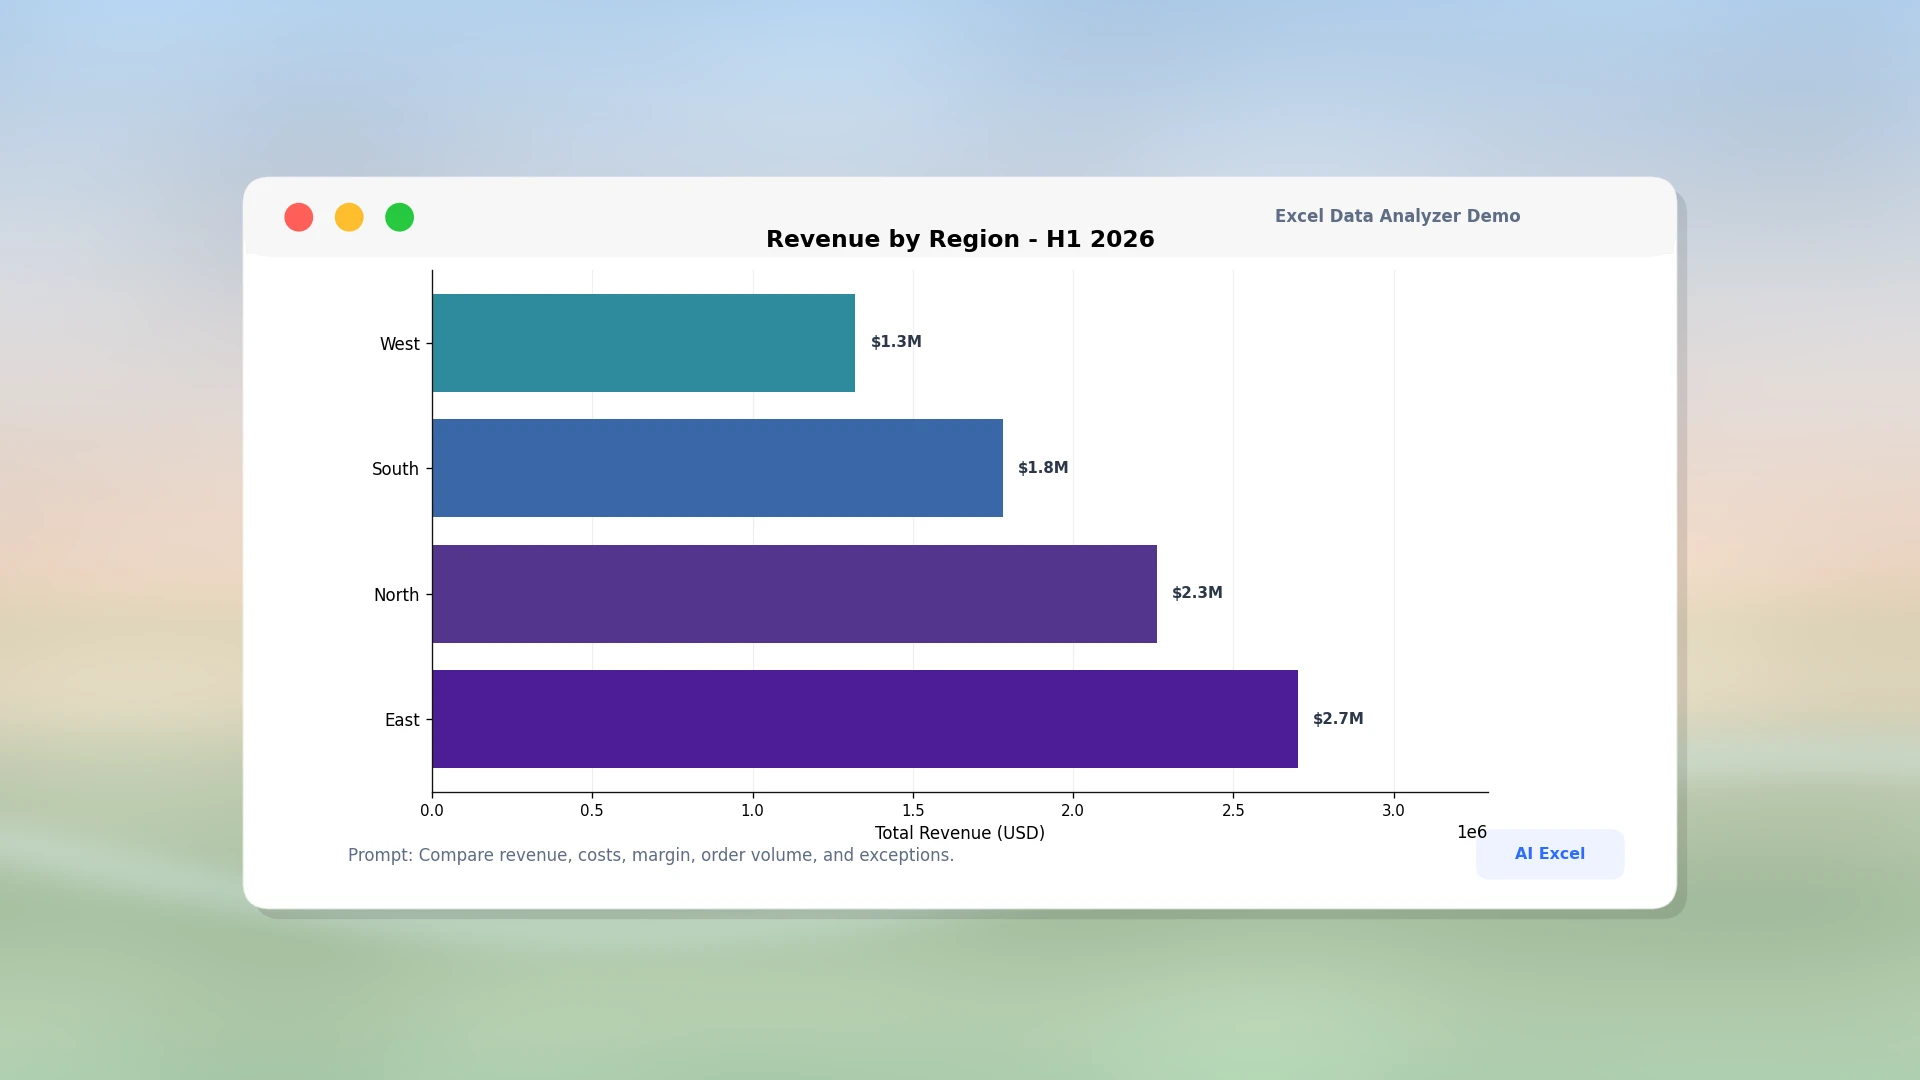
Regional Performance Review
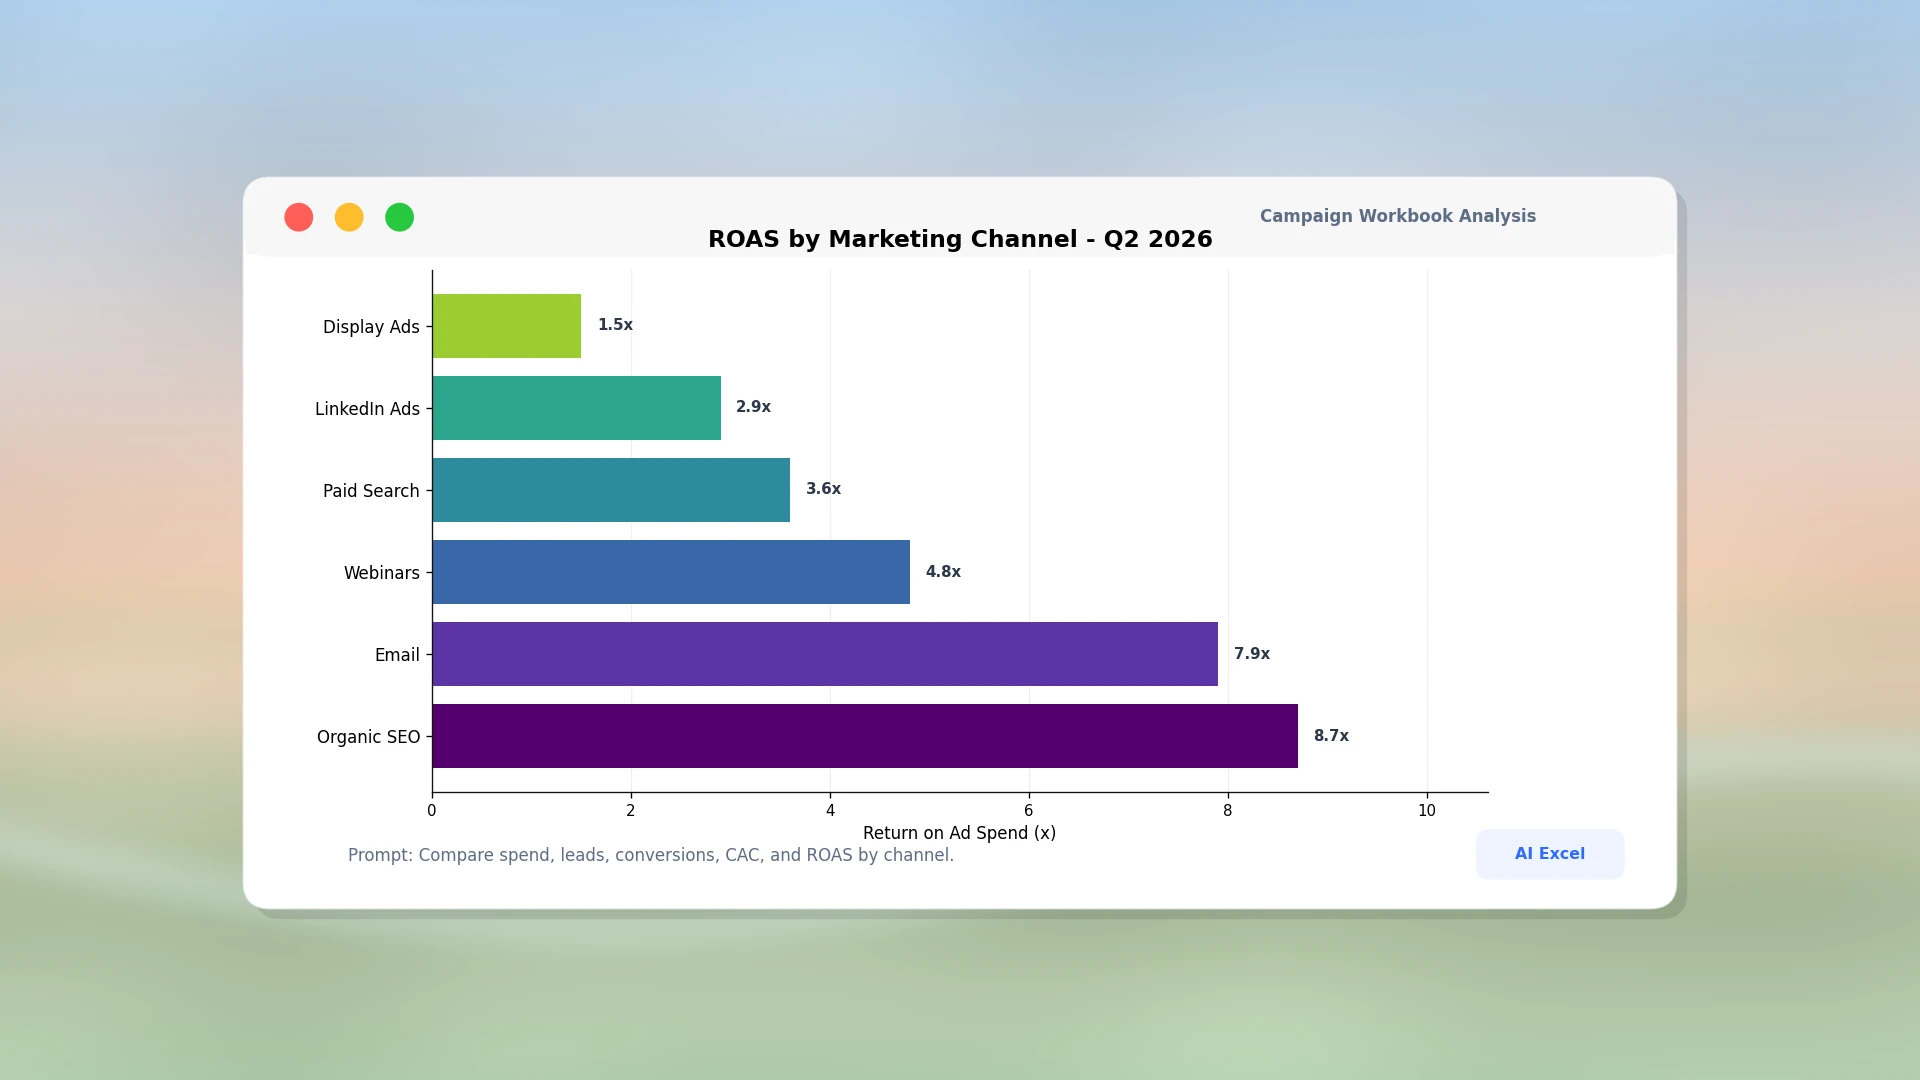
Marketing Campaign Analyzer
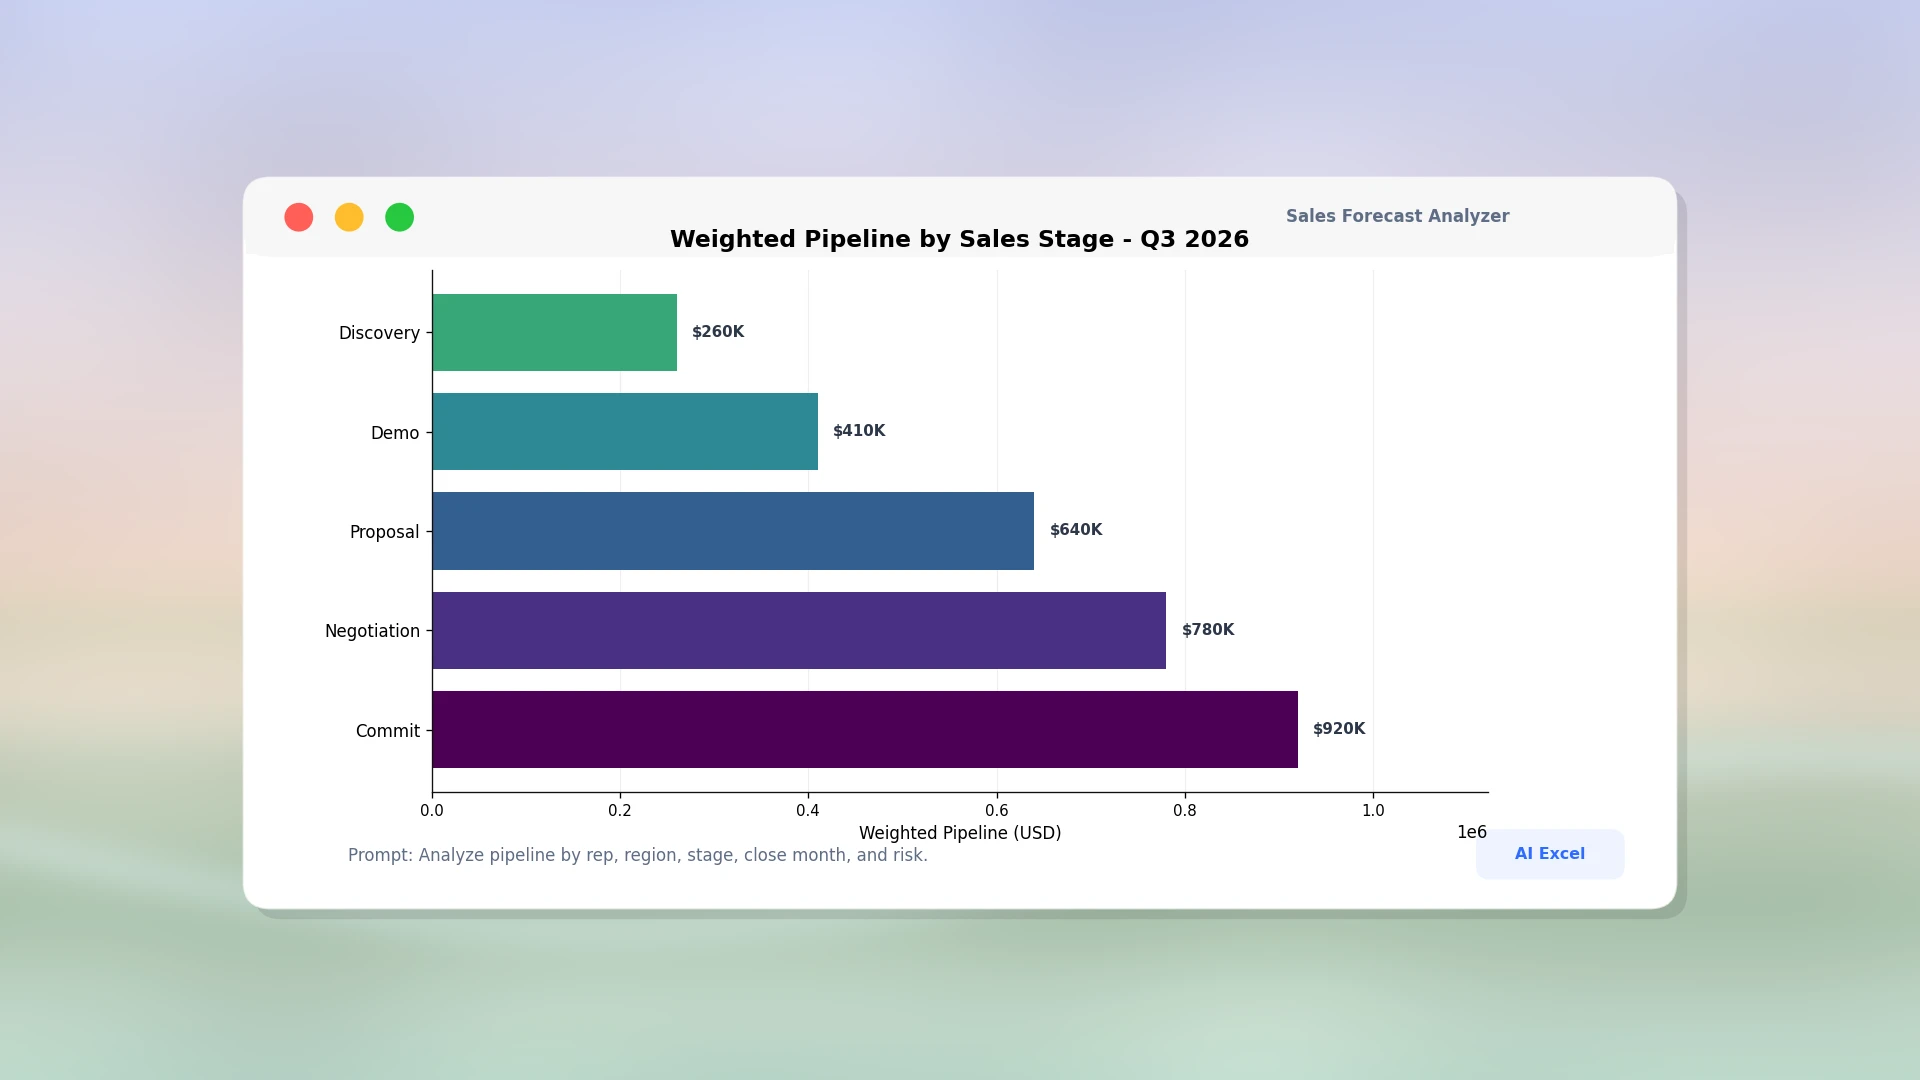
Sales Pipeline Analyzer
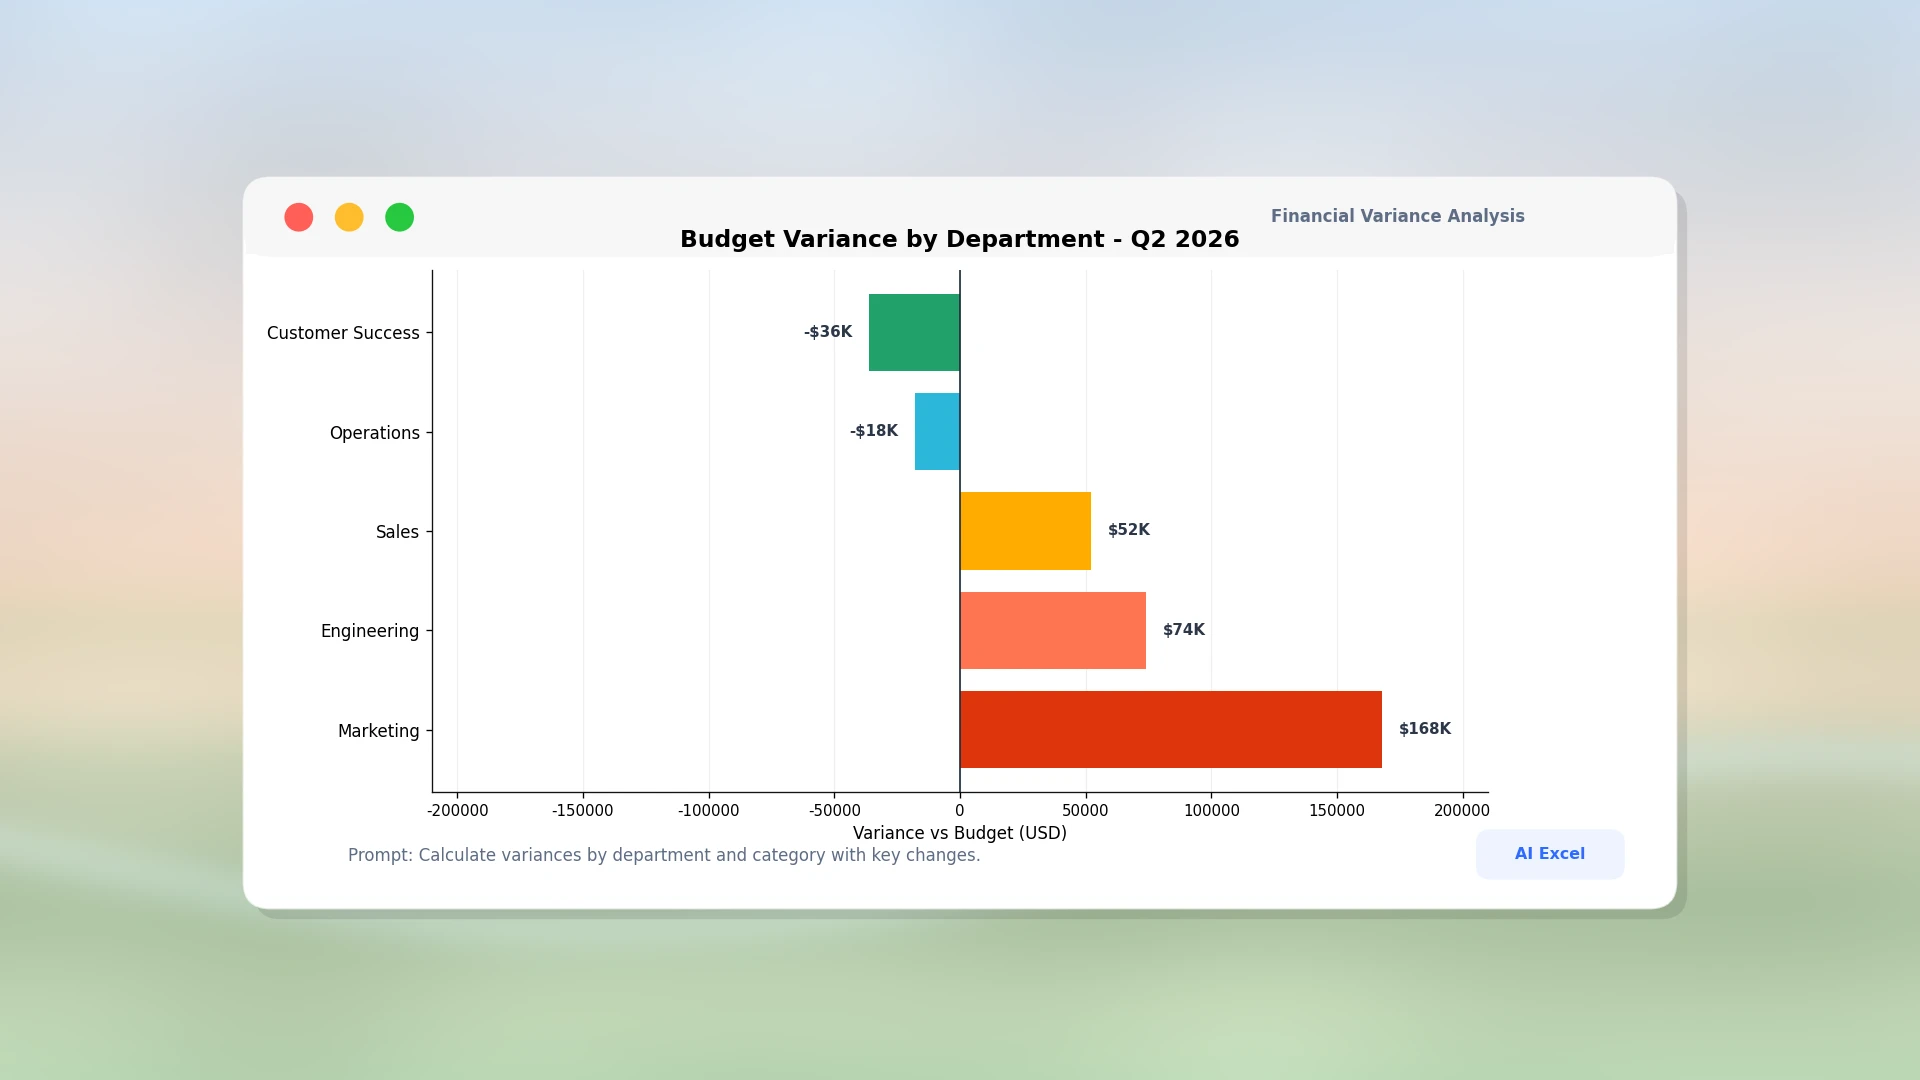
Financial Variance Analyzer
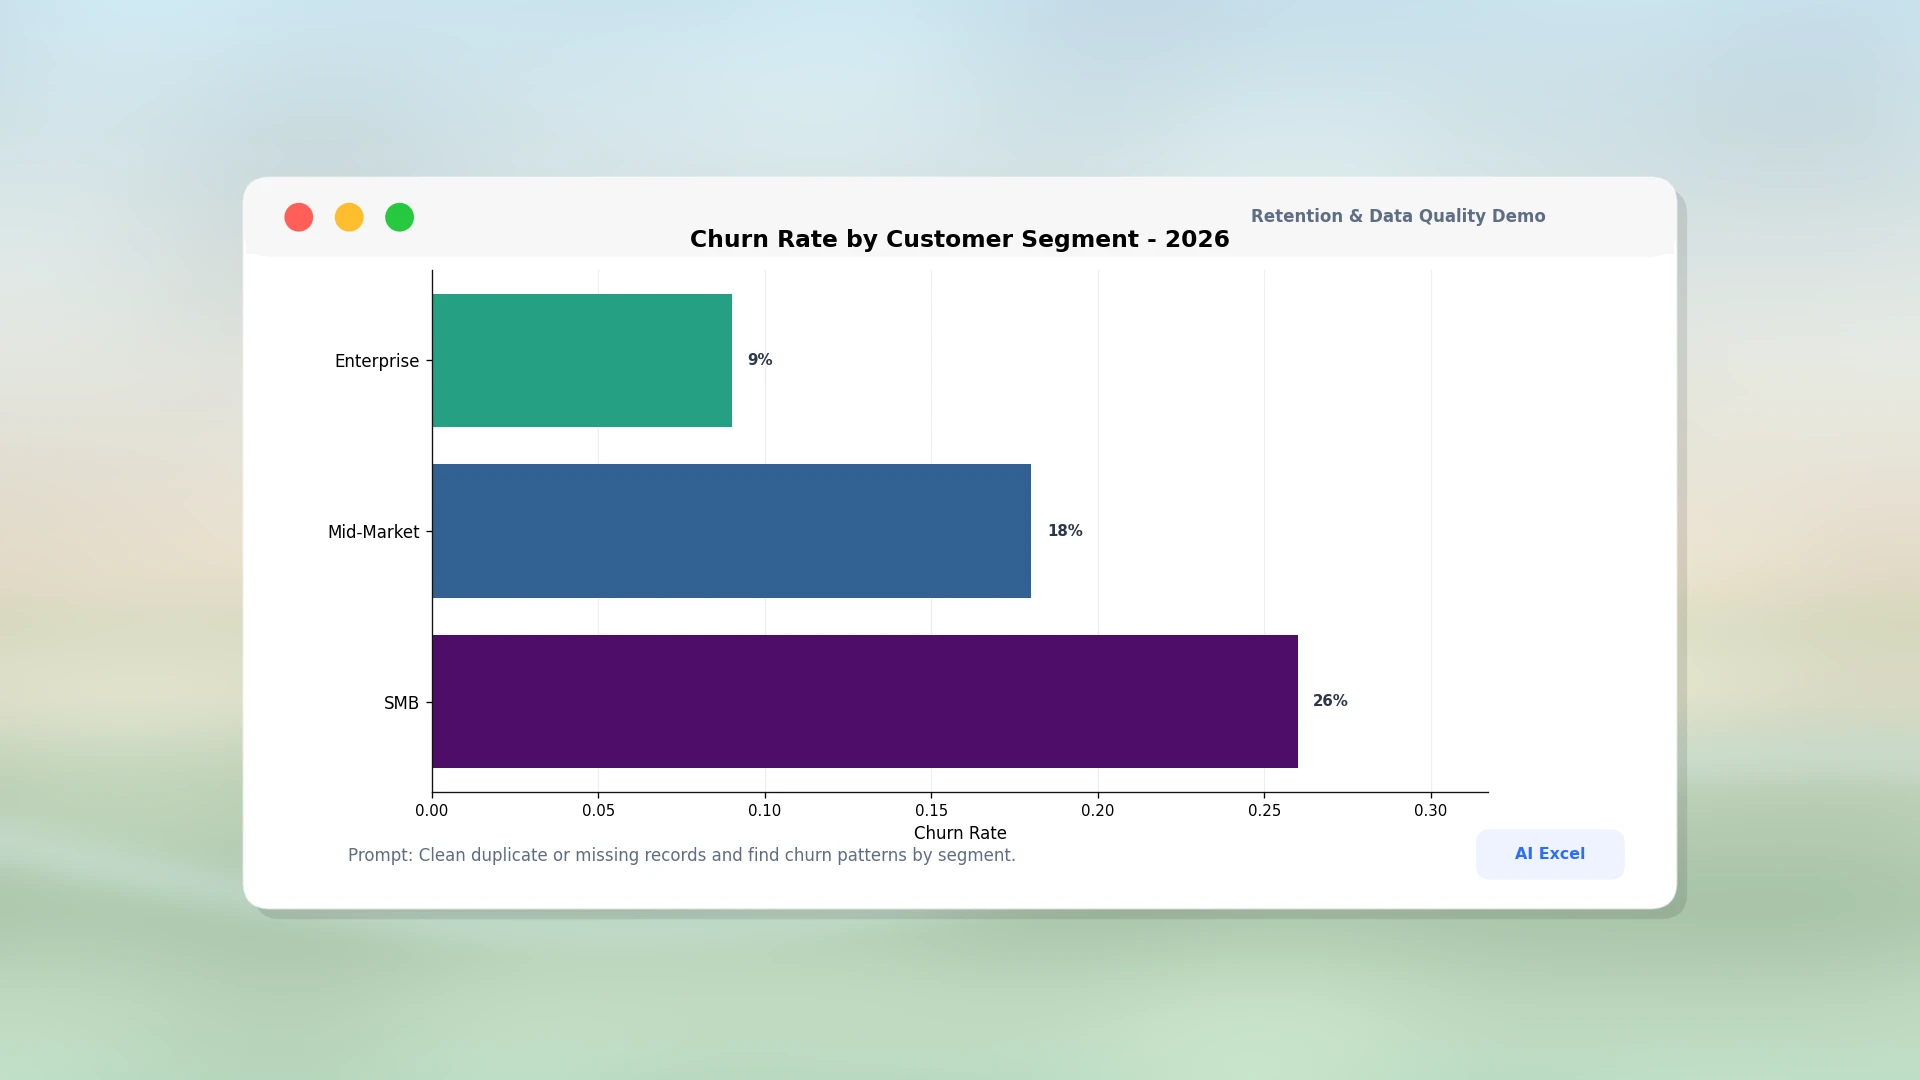
Customer Retention Data Analyzer

AI Excel Data Analyzer: Free Online, No Sign-Up

AI Excel Data Analyzer from TutorGPT lets you upload Excel files, analyze data instantly, generate charts, visualize trends, and create reports online for free.

AI Excel Data Analyzer: Free Online, No Sign-Up

Trusted Worldwide

Built on reliable AI technology for effective learning and homework support. Trusted by learners, educators, and professionals worldwide.

Dublin
Atlanta
Klien
Davis
Capistirano
Everrette
Buffalo
Denver--public-school
Appleton
Greenville
HCS
Seattle-Public-Schools
Northside
Irvine
Norfolk
PCS
TheSteppingStonesGroup_black
Napperville
Logo24
YouTube
Princeton
Dublin
Atlanta
Klien
Davis
Capistirano
Everrette
Buffalo
Denver--public-school
Appleton
Greenville
HCS
Seattle-Public-Schools
Northside
Irvine
Norfolk
PCS
TheSteppingStonesGroup_black
Napperville
Logo24
YouTube
Princeton
Dublin
Atlanta
Klien
Davis
Capistirano
Everrette
Buffalo
Denver--public-school
Appleton
Greenville
HCS
Seattle-Public-Schools
Northside
Irvine
Norfolk
PCS
TheSteppingStonesGroup_black
Napperville
Logo24
YouTube
Princeton

What is TutorGPT's AI Excel Data Analyzer?

Upload a workbook and turn rows, formulas, and multiple sheets into clear findings. AI Excel Data Analyzer creates charts, highlights trends, and builds visual reports online, helping you move from raw tables to useful answers without setting up every formula, filter, or graphic by hand.

What is TutorGPT's AI Excel Data Analyzer?

Tired of Building Every Excel Chart by Hand?

Large workbooks hide useful patterns across tabs, while manual formulas and chart setup slow every review. Your data should lead to answers, not more formatting work. With AI Excel Data Analyzer, you skip the repetitive setup and start from clear visuals instead.

Tired of Building Every Excel Chart by Hand?

Turn Workbooks into Clear Decisions

Explore spreadsheet trends, create charts, and present findings from one guided workspace.

Generate Charts from Your Workbook

Charting is now faster — the analyzer converts selected values and questions into useful visuals.

Build Visual Reports Around Key Trends

No more assembling every summary by hand: visual reports connect findings with clear graphics.

Review Related Data Across Multiple Sheets

From separate tabs to a joined view, multi-sheet analysis connects related data so you don't have to.

Simplify Spreadsheet Work for Every Team

Business Analysts

Business Analysts

Business analysts can use AI Excel Data Analyzer to compare operational measures and turn exceptions into decision-ready visuals.

Analyze a Workbook in 3 Simple Steps

Step 1: Upload Your Workbook

Step 1: Upload Your Workbook

Add your spreadsheet and make sure each table has clear headers.

Step 2: Describe the Analysis

Step 2: Describe the Analysis

Ask a focused question and name the sheets, fields, or date range to review.

Step 3: Review Charts and Findings

Step 3: Review Charts and Findings

Check the generated visuals, validate key figures, and use the report.

Start Exploring Your Workbook Online

Upload your workbook. Get charts and trends quickly. Try the free online AI Excel Data Analyzer workflow without signing up.

How Spreadsheet Teams Use the Analyzer

Maya Thompson avatar

Maya Thompson

Business Analyst

A quarterly performance review used to mean copying figures from four regional tabs into a separate dashboard. TutorGPT's AI Excel Data Analyzer gave me a quicker first pass across those sheets and produced charts I could use to discuss the biggest changes. I still verified totals against the source workbook, but the visual starting point saved time and helped me focus the meeting on exceptions instead of spreadsheet setup.
Daniel Kim avatar

Daniel Kim

Marketing Manager

Our campaign workbook mixes spend, leads, and conversion data across separate tabs. TutorGPT's Excel Data Analyzer helped me compare those views and turn the main movements into a readable visual report. The useful part was not replacing my judgment; it reduced the repetitive chart-building work, so I had more time to investigate why one channel improved while another fell behind.
Olivia Carter avatar

Olivia Carter

Sales Manager

I received a sales workbook with inconsistent regional summaries and needed a clear view before the pipeline call. TutorGPT's AI Excel Analyzer surfaced the major differences and drafted charts that made the outliers easier to explain. I checked the filters and source rows before presenting anything, yet moving from raw tables to a focused discussion was much faster than building every visual manually.
Ethan Brooks avatar

Ethan Brooks

Financial Analyst

Month-end analysis often involves moving between actuals, budget, and variance sheets. TutorGPT's workflow helped me analyze Excel files together and shape the results into a concise report for review. It preserved the need for financial checks, but it removed much of the early formatting work and gave me a practical outline for explaining the largest variances to stakeholders.
Sofia Ramirez avatar

Sofia Ramirez

Data Analyst

A customer retention workbook had several tabs, many category labels, and more rows than I wanted to scan manually. TutorGPT's analyzer let me analyze Excel data around a specific question, then generated visuals that pointed to segments worth testing. Because the output was easy to inspect, I could validate the pattern with my own calculations before adding it to the team report.
Liam Foster avatar

Liam Foster

Operations Manager

Preparing a weekly operations update used to require separate charts for volume, delays, and team capacity. TutorGPT's workbook analyzer brought those views into one visual reporting flow and gave me a cleaner draft to refine. There was almost no learning curve: I uploaded the workbook, described the comparisons I needed, reviewed the ranges, and adjusted the narrative before sharing it.

Frequently Asked Questions